Analyzing US Economic Data and Building a Dashboard
Description
Extracting essential data from a dataset and displaying it is a necessary part of data science; therefore individuals can make correct decisions based on the data. In this assignment, you will extract some essential economic indicators from some data, you will then display these economic indicators in a Dashboard. You can then share the dashboard via an URL.
Gross domestic product (GDP) is a measure of the market value of all the final goods and services produced in a period. GDP is an indicator of how well the economy is doing. A drop in GDP indicates the economy is producing less; similarly an increase in GDP suggests the economy is performing better. In this lab, you will examine how changes in GDP impact the unemployment rate. You will take screen shots of every step, you will share the notebook and the URL pointing to the dashboard.
Table of Contents
- Define a Function that Makes a Dashboard
- Question 1: Create a dataframe that contains the GDP data and display it
- Question 2: Create a dataframe that contains the unemployment data and display it
- Question 3: Display a dataframe where unemployment was greater than 8.5%
- Question 4: Use the function make_dashboard to make a dashboard
- (Optional not marked) Save the dashboard on IBM cloud and display it
Estimated Time Needed: 180 min
Define Function that Makes a Dashboard
We will import the following libraries.
import pandas as pd
from bokeh.plotting import figure, output_file, show,output_notebook
output_notebook()
In this section, we define the function make_dashboard.
You don't have to know how the function works, you should only care about the inputs. The function will produce a dashboard as well as an html file. You can then use this html file to share your dashboard. If you do not know what an html file is don't worry everything you need to know will be provided in the lab.
def make_dashboard(x, gdp_change, unemployment, title, file_name):
    output_file(file_name)
    p = figure(title=title, x_axis_label='year', y_axis_label='%')
    p.line(x.squeeze(), gdp_change.squeeze(), color="firebrick", line_width=4, legend="% GDP change")
    p.line(x.squeeze(), unemployment.squeeze(), line_width=4, legend="% unemployed")
    show(p)
The dictionary links contain the CSV files with all the data. The value for the key GDP is the file that contains the GDP data. The value for the key unemployment contains the unemployment data.
links={'GDP':'https://cf-courses-data.s3.us.cloud-object-storage.appdomain.cloud/IBMDeveloperSkillsNetwork-PY0101EN-SkillsNetwork/labs/FinalModule_Coursera/data/clean_gdp.csv',\
       'unemployment':'https://cf-courses-data.s3.us.cloud-object-storage.appdomain.cloud/IBMDeveloperSkillsNetwork-PY0101EN-SkillsNetwork/labs/FinalModule_Coursera/data/clean_unemployment.csv'}
Question 1: Create a dataframe that contains the GDP data and display the first five rows of the dataframe.
Use the dictionary links and the function pd.read_csv to create a Pandas dataframes that contains the GDP data.
Hint: links["GDP"] contains the path or name of the file.
csv_path=links['GDP']
df=pd.read_csv(csv_path)
Use the method head() to display the first five rows of the GDP data, then take a screen-shot.
df.head()
| date | level-current | level-chained | change-current | change-chained | |
|---|---|---|---|---|---|
| 0 | 1948 | 274.8 | 2020.0 | -0.7 | -0.6 |
| 1 | 1949 | 272.8 | 2008.9 | 10.0 | 8.7 |
| 2 | 1950 | 300.2 | 2184.0 | 15.7 | 8.0 |
| 3 | 1951 | 347.3 | 2360.0 | 5.9 | 4.1 |
| 4 | 1952 | 367.7 | 2456.1 | 6.0 | 4.7 |
Question 2: Create a dataframe that contains the unemployment data. Display the first five rows of the dataframe.
Use the dictionary links and the function pd.read_csv to create a Pandas dataframes that contains the unemployment data.
csv_path=links['unemployment']
df=pd.read_csv(csv_path)
Use the method head() to display the first five rows of the unemployment data, then take a screen-shot.
df.head()
| date | unemployment | |
|---|---|---|
| 0 | 1948 | 3.750000 |
| 1 | 1949 | 6.050000 |
| 2 | 1950 | 5.208333 |
| 3 | 1951 | 3.283333 |
| 4 | 1952 | 3.025000 |
Question 3: Display a dataframe where unemployment was greater than 8.5%. Take a screen-shot.
csv_path=links['unemployment']
df=pd.read_csv(csv_path)
df1=df[df['unemployment']>8.5]
df1
| date | unemployment | |
|---|---|---|
| 34 | 1982 | 9.708333 |
| 35 | 1983 | 9.600000 |
| 61 | 2009 | 9.283333 |
| 62 | 2010 | 9.608333 |
| 63 | 2011 | 8.933333 |
Question 4: Use the function make_dashboard to make a dashboard
In this section, you will call the function make_dashboard , to produce a dashboard. We will use the convention of giving each variable the same name as the function parameter.
Create a new dataframe with the column 'date' called x from the dataframe that contains the GDP data.
# Create your dataframe with column date
csv_path=links['GDP']
gdp_dataframe=pd.read_csv(csv_path)
x = pd.DataFrame(gdp_dataframe, columns=['date'])
Create a new dataframe with the column 'change-current' called gdp_change from the dataframe that contains the GDP data.
# Create your dataframe with column change-current
gdp_change = pd.DataFrame(gdp_dataframe, columns=['change-current'])
Create a new dataframe with the column 'unemployment' called unemployment from the dataframe that contains the unemployment data.
# Create your dataframe with column unemployment
csv_path=links['unemployment']
unemploy_dataframe= pd.read_csv(csv_path)
unemployment = pd.DataFrame(unemploy_dataframe, columns=['unemployment'])
Give your dashboard a string title, and assign it to the variable title
# Give your dashboard a string title
title = "Unemployement stats & GDP"
Finally, the function make_dashboard will output an .html in your direictory, just like a csv file. The name of the file is "index.html" and it will be stored in the varable file_name.
file_name = "index.html"
Call the function make_dashboard , to produce a dashboard. Assign the parameter values accordingly take a the , take a screen shot of the dashboard and submit it.
# Fill up the parameters in the following function:
make_dashboard(x=x, gdp_change=gdp_change, unemployment=unemployment, title=title, file_name=file_name)
BokehDeprecationWarning: 'legend' keyword is deprecated, use explicit 'legend_label', 'legend_field', or 'legend_group' keywords instead
BokehDeprecationWarning: 'legend' keyword is deprecated, use explicit 'legend_label', 'legend_field', or 'legend_group' keywords instead
How to submit
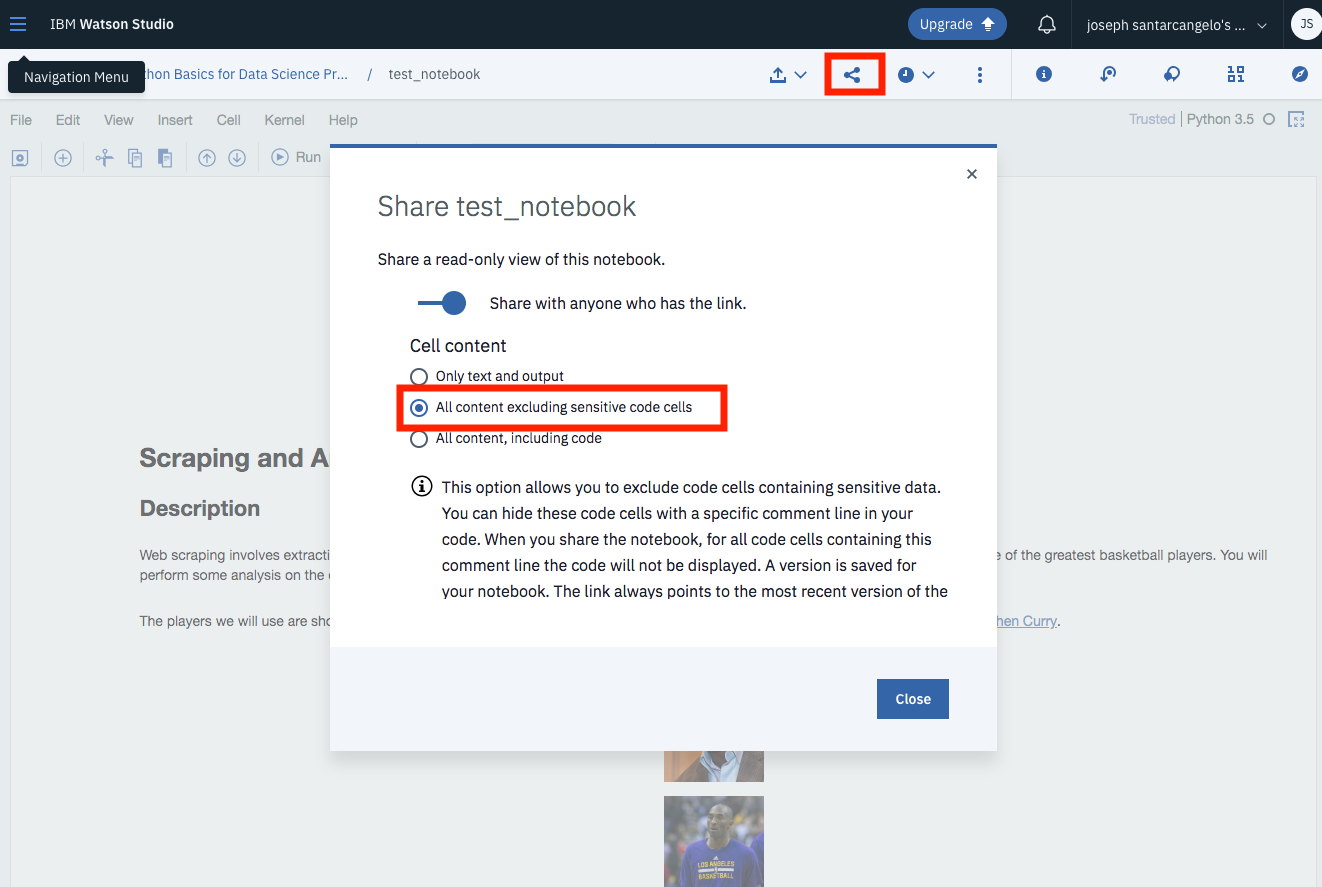
Once you complete your notebook you will have to share it to be marked. Select the icon on the top right a marked in red in the image below, a dialogue box should open, select the option all content excluding sensitive code cells.
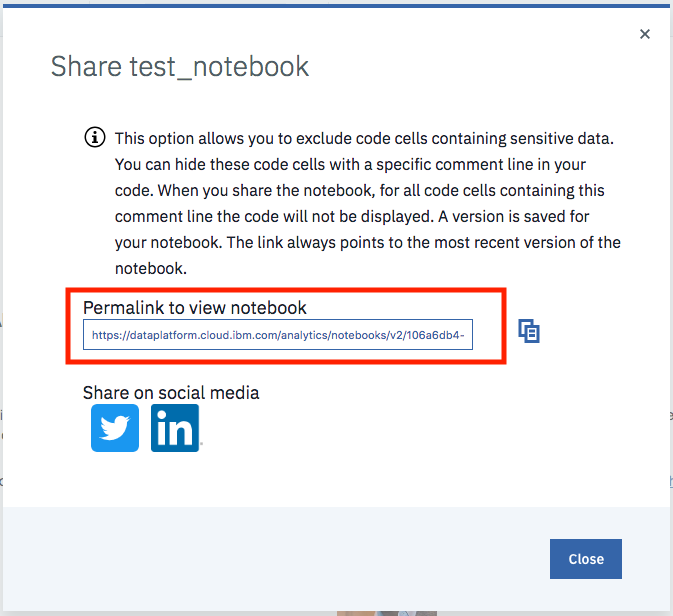
You can then share the notebook via a URL by scrolling down as shown in the following image:
Copyright © 2019 IBM Developer Skills Network. This notebook and its source code are released under the terms of the MIT License.
About the Authors:
Joseph Santarcangelo has a PhD in Electrical Engineering, his research focused on using machine learning, signal processing, and computer vision to determine how videos impact human cognition. Joseph has been working for IBM since he completed his PhD.
Other contributors: Yi leng Yao, Mavis Zhou
References :
-
<il>
1) Economic Research at the St. Louis Fed : Civilian Unemployment Rate
</il>
<il> 2) Data Packaged Core Datasets </il>
Change Log
| Date (YYYY-MM-DD) | Version | Changed By | Change Description |
|---|---|---|---|
| 2020-11-10 | 1.1 | Malika Singla | Deleted the Optional part |
| 2020-08-27 | 1.0 | Malika Singla | Added lab to GitLab |
© IBM Corporation 2020. All rights reserved.